Two key concepts to get to grips with when trading with binary options are those of Support and Resistance levels. They are perhaps two of the most basic elements of technical analysis and it is vital that you have a good understanding of them.
They are easily to understand and can easily be applied to any strategy to provide trade verification. They can be used to identify points to place stops or levels at which to take profits.
Their simplicity helps to make this one of the binary options trading strategies for beginners.
Understanding Support And Resistance
The terms ‘support and resistance‘ refer to levels in the market that have previously stalled price gains or falls. Essentially they identify points at which sellers of an asset are prepared to enter the market (in the case of support) or liquidate their gains (in the case of resistance).
Here’s a brief definition: -
- A support level sits under the current price. It is therefore often referred to as the price ‘floor.’
- A resistance level sits above the current price. It is therefore considered to be the price ‘ceiling’.
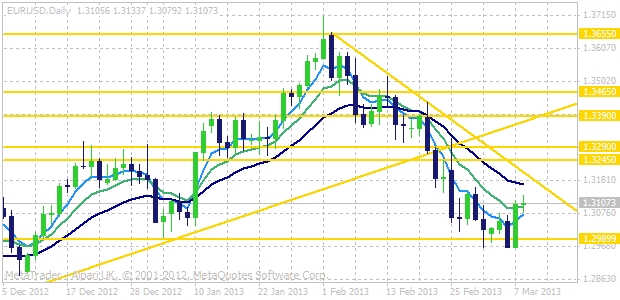
Take a look at the image below. It shows a daily chart of the EUR/USD. A number of support and resistance levels have been plotted across the chart. These can be interpreted as the expected points at which buyers and sellers will enter the market when these price levels near.
Note also how these levels can also be formed from rising and falling trends in the price. You can also see how the moving averages also provide support and resistance to price movement both when the price is rising and falling.
A further important point to note about support and resistance is the way in which these levels change when the price moves through them.
Once a level of resistance is breached by the price it then becomes a new level of support. Similarly once a support level is breached it will then provide resistance to subsequent gains in price.
Identifying Levels
There are a number of ways in which support and resistance levels can be identified. It would be wrong to assume that they are some unique and mystical level. Common support and resistance levels can be previous highs and lows, rising channel levels, retracement levels or pivot points.
They can often be easily be identified by taking a look at the price chart and visually noting where price movements have previously stalled or bounced.
When looking for these levels it is important to note that support and resistance levels that exist in higher chart time-frames such as on the daily or weekly charts, are going to be stronger than those from say, a 5 or 15 minute chart. Also consider that if a level has been tested and held many times previously, then it will take a strong impetus to breach when the price nears it again.
Another place where support an resistance occurs is at psychological price levels. All time highs and lows or new ‘trading ranges’ can also reject price moves. For example, when the price first approaches a new high a temporary sell off may be triggered, with price high being seen as resistance to further gains. Often a significant change in fundamental market outlook is required for a price to push and sustain gains into this new range.
Support and Resistance Binary Options Strategy
While support and resistance levels are an important trading concept, they should be considered complementary to a strategy, rather than the basis of a complete trading strategy for binary options in themselves.
Having said that, you could form a really simple support and resistance binary options strategy based on the expected price rejection whenever a support or resistance level is neared. This could be a suitable way in which to profit from price rejections near strong support/resistance near all time highs or lows.
A better approach to using these technical levels would however be to combine them with the use of a technical indicator. For example you would mark key levels on a chart and then look for overbought/oversold readings on a technical indicator such as the RSI to form a overbought or oversold strategy.
Things To Consider
While these levels are invaluable for the trader, don’t make the mistake of putting all of your faith in them. Support and resistance levels are not permanent. You need to expect the price to push through them at some point
The general theory is that the more times that a level has been tested, the stronger it will be. Therefore it is worth noting the levels which exist on high time-frame charts (daily, weekly) even if you are trading on low time-frames. Levels set at these higher levels will be stronger and therefore less likely to fail.
An important point to consider when trading a support and resistance binary options strategy is that these levels are not absolute. Often an enthusiastic market can see an asset price temporarily extend. Therefore be prepared to use a measure of tolerance. Depending on the market that you are trading, 5-10 price ticks either side of the identified level would be a good starting point.
Like much of technical analysis there is no concrete reason why support and resistance levels should work although it is evident that most times they simply do.
An explanation could be that they are self-filling. As they are given so much attention by traders, it is conceivable that the sheer volume of orders situated at these points can cause the anticipated reaction to happen.
However, no matter how or why, binary options support and resistance trading systems tend to work.
You should get a good grasp of how these levels work if you want to maximize your potential for making trading profits.